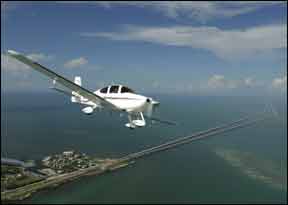
When Cirrus kicked open the barroom doors in 1999 with an innovative new airplane equipped with a parachute, it promised to turn the page on light aircraft safety. In our initial report on the Cirrus SR20, we deemed it “one of the most crashworthy airplanes in GA history.”

A dozen years hence, does the accident history support the expectations? Has Cirrus delivered what many buyers hoped it would? And while we’re at it, how does it compare to other models? Which have the best accident rates, which the worst?
To answer these questions, we recently completed an exhaustive research project into the accident history of 11 popular aircraft models. We read and sorted more than 500 accident reports and compiled the data into what we believe is a reasonably accurate and fair assessment of how the airplanes compare.
Bottom line: The Cirrus composite accident rate (both models combined) finishes in the middle of the pack of GA piston aircraft. It’s neither exceptionally good nor exceptionally bad. Its overall accident rate is much better than GA as a whole, but its fatal rate is measurably worse than both the GA average and the average of the 11 models reviewed. The SR20’s accident rate is tied for the second worst.
Worth noting here is that measured accident rate is not the same as safe or unsafe, nor are we able to make unassailable claims and observations about crashworthiness. In our view, the data to do this isn’t available in publicly accessible NTSB records. Further, at least in the case of Cirrus, one of its major safety features—the Cirrus Airframe Parachute System or CAPS—is not passive, but requires active judgment and intervention by the pilot, thus the accident rate is a measure of how these combined factors have worked (or not) in the real world. Given this unique aspect of the Cirrus models, “safety” is more inextricably tied to pilot competence and training than is so in other models.
Push Restart
The long-accepted method of measuring risk and crash rates is to compare accidents against known exposure. In aviation, the accepted increment of exposure is 100,000 flight hours. Unfortunately, until Cirrus came along, if manufacturers maintained hours-flown data on their aircraft, they haven’t made it available to the press or public. But through warranty claims, parachute repack cycles and other methods, Cirrus has maintained this data and we believe it to be accurate.
Here’s how we tested the Cirrus claims: Bluebook Price Digest maintains its own database of average hours flown per year through reports it gathers on actual sales of aircraft. Bluebook’s estimates that fleetwide, both the SR20 and 22 are flown an average of 175 hours a year. Using this value, we stratified the Cirrus fleet numbers by year and calculated total fleet hours. Our independent calculation agreed with Cirrus’s numbers within 4 percent, so we’re confident the hours-flown numbers are as fair as we can make them. We have similar confidence in the hours-flown calculations for other models for which we used the same Bluebook data source. Diamond provided additional fleet hours information.
At about the same time that Cirrus began production, Cessna’s restart of piston production provided us with an opportunity to restart the clock. Cessna’s restart models have new model designations which appear in NTSB reports, so we can segregate them from legacy aircraft.
For most of the models reviewed here, our survey period began in 1997, when Cessna re-entered the market. However, for both the Saratoga and the Mooney models, we had to extend the period into the 1980s and 1990s to obtain workable model designations and production numbers. For most production numbers, we used General Aviation Manufacturers Association data but for some, we used FAA registry data.
Some caveats: Our survey covers mostly N-number airplanes and U.S. crashes. Where possible, we have obtained some data on foreign crashes, but it’s not complete. For reasons not clear to us, we know that the NTSB’s Website doesn’t list all accidents, especially minor ones. Some simply aren’t reported. But it does list most accidents involving fatalities. We’ve used the best of all data available for our calculations.
For additional fact checking on the Cirrus models, Rick Beach, who has studied the airplane’s accident history extensively for the Cirrus Owners and Pilots Association, generously helped.
Last, the tyranny of small numbers. Given the relatively paltry fleet hours (even by Cirrus and Cessna), an additional accident or two can bump the rates noticeably. For that reason, we think the numbers should be seen comparatively, not as absolutes. However, the Cirrus numbers are the most accurate.
Cirrus Dissected
All together, we found 172 Cirrus accidents for both models, 83 of which involved fatalities, giving Cirrus the dubious distinction of having the highest percentage of accidents that proved fatal among the group of airplanes we studied. As the chart shows, almost half of all Cirrus accidents involve at least one fatality.
This high number may relate to both the type of mission Cirrus owners tend to fly and the type of accident that results, namely flights into significant weather in which an upset or loss of control may result in terrain impact at unsurvivably high speeds. Also, if the NTSB reports are accurate, nearly two dozen of the fatal Cirrus accidents we reviewed appeared to be stall or spin related, despite Cirrus’s stall/spin-resistant wing and the availability of CAPS. This is hardly to suggest that other models don’t have stall/spin accidents, but the Cirrus line was near the top of the list for stall accidents. The Mooney series had eight, the Cessna 182 had six and Columbia and Diamond had none that we could find. Although we’ve listed the Cirrus overall and accident rates as a composite, there’s enough data to differentiate the SR20 from the SR22. The SR20’s overall accident rate is 3.2/100,000 hours, which places it squarely in the middle of the surveyed aircraft and at about half the GA rate of 6.3 GA overall rate. The SR22’s overall rate, at 3.3, is a statistical dead heat with the SR20.
But there’s more daylight between the fatal rates. At 1.54, the SR22 is in the middle of the pack and above the 1.2 GA average. The SR20 is near the bottom of our survey, at 1.8/100,000. Given the small numbers involved, we can’t make much of this statistical difference other than to point out that it exists.
If there’s any meaningful pattern between the SR20 and SR22 accidents, we can’t see it other than to observe when accident causes are compared as a percentage of total accidents, there are two vagaries: For the SR22, stalls are mentioned as a cause in 16 percent of accidents, while for the SR20, the number appears to be 7 percent. And note that the incidence of CFIT is higher for the SR20 than for the SR22, which may have something to do with less experienced or non-instrument rated pilots flying it. (Or our interpretation biases.)
Other Models
When the Cirrus is measured against other aircraft which occupy a similar market niche, there are plusses and minuses. On the plus side, our data shows that the SR22 has a better fatal accident rate and a better overall accident rate than the Mooney M,R,S series, against which we compared it. It also bests the Cessna 206 and 172 on overall accident rates. The SR20 is similarly midstream when overall accidents are considered.
We were especially interested in how the Cirrus models would compare to the Columbia/Corvalis, which competes in the same market space. The Columbia/Corvalis has a slightly worse overall rate, but a better fatal rate. But given the aforementioned small number effect, they’re very similar. Not so the Diamonds, however, which top our list with the both lowest overall and lowest fatal rates.
Cirrus aficionados will point out that the Columbia line has far fewer airframes (about 704 compared to Cirrus’ 5000-plus) and that the Diamond is more of a trainer than a cruiser. While both claims have merit, it’s also true that rates are rates and we’re measuring an airplane’s performance in the design arena for which was intended. Moreover, the SR20 and DA40 are both used in training and in IMC.
The Columbia/Corvalis, which has no parachute system, has an apparent accident rate that’s about the same or maybe a bit better. Is this due to different mission profiles? We doubt it, for the Columbia/Corvalis is a fast, go-places airplane that’s flown in actual IMC on long trips.
Some also believe Cirrus airplanes tackle more serious weather more often than other models and accident data may support this.
When we posed this question to COPA’s Rick Beach, his theory was that the Columbia tended to attract pilots more interested in aviation for its own sake, while Cirrus buyers trend more to aviation as a means to an end—a transportation mode that just happens to involve flying.
If Columbia pilots are more experienced than Cirrus pilots, it certainly doesn’t show in the data. Pilot experience is only sketchily provided in NTSB accident summaries. It’s usually available for fatal accident reports, but not always. From what data we could glean—and that’s not for every accident, by any means—Cirrus accident pilots averaged 1454 hours with 240 in type, while Columbia pilots averaged 1631 hours with 237 hours in type. To us, that’s no difference at all. Mooney pilots, who have a worse overall and fatal rate than Cirrus pilots do, averaged 1810 hours and 913 hours in type.
One thing that is noticeable in accident narratives is how willing some low-time Cirrus pilots are to take on challenging weather. In one well-reported accident, an SR22 departed Reno/Tahoe for a night flight in high-overcast IMC over mountainous terrain. The pilot encountered unforecast icing, lost control and may have tried to deploy CAPS outside the max operating speed envelope, causing it to fail. The pilot had 473 hours total time with 69 hours in type.
Although this may or may not be an example of it, some Cirrus owners believe that risk homeostasis—the phenomenon of assuming more flight risk because CAPS is standing by to bail you out—could be a factor in the Cirrus accident rate. (See the sidebar on page 7.) On the other hand, we see these kinds of judgments among pilots of other models, too.
Other Factors
As discussed in the sidebar, there have been 31 CAPS deployments, representing about 18 percent of all Cirrus accidents. Since the airplane is significantly damaged by deployment, although not always to the point that it can’t be flown again, we consider CAPS deployments an accident.
Overall, the outcome of CAPS deployments has been positive and, in fact, perhaps better than Cirrus predicted. The deployments have yielded few injuries and about a dozen of the aircraft involved were repaired and returned to service, something Cirrus didn’t necessarily envision.
Do these models do better than aluminum or other composites in crash survival performance? Crash tests suggest they should, but we can’t say for sure because we don’t have enough information on impact damage and forces. We did, however, track the incidence of injury in crashes that weren’t fatal.
For the Cirrus, the rate was 15 percent; the Cessna 182 was 7 percent, the Mooneys 11 percent and the Columbia/Corvalis 4 percent. The Diamond DA40 had 26 percent—but this data is quite sketchy, especially on foreign crashes.
Self-ignited post-crash fire is always a worry in crash survivability and here, with the exception of Diamond’s DA40, all of the aircraft seem to perform similarly. At 16 percent, the SR22 has the highest rate of post-crash fire incidence, with the Columbia right behind at 14 percent and the Mooneys, SR20 and Cessna 182 at 11 or 12 percent.
Only the DA40, with fuel tanks protected in aluminum cells behind two massive spars, has no history of self-ignited post-crash fire. Diamond told us one DA20 suffered a fire after striking powerlines, but this doesn’t appear in the NTSB database and we don’t have details on it.
Conclusion
Critics of Cirrus have claimed that the company simply hasn’t delivered safe airplanes, but we don’t agree and believe this overstates the case. According to our data, Cirrus has more of an average safety record in a market that may have expected better, since it has the CAPS parachute as the ultimate backstop.
Taken together, the SR20 and 22 have an overall accident rate in middle of the road for aircraft we examined. The composite fatal accident rate appears to be worse than the GA average, but somewhat better than other models we examined.
If we could fault Cirrus for anything, it would be two things: In our view, it underestimated the cultural challenge of integrating a parachute into the airplane’s basic safety ethos in a way that would fundamentally improve its safety. And although we think the stall-resistant wing Cirrus used is laudable, the airplanes may have a slightly higher incidence of stall-related accidents than other models appear to. Part of this can be addressed by training, but we wonder what else might be done to make the airplane more stall resistant.
One answer to that may be better training in the use of CAPS, which is, in fact, the recommended spin-recovery response. If just one-third of recorded Cirrus fatal accidents had been CAPS saves instead, the Cirrus fatal rate would be we’ll below the GA average, thus delivering the level of safety many thought that Cirrus promised in the first place.
The direct comparison with the Columbia is revealing because even with CAPS, the Cirrus fatal rate lags a little behind what is essentially a similar airplane.
Cirrus’s Bill King, who tracks safety data for the company, acknowledges that Cirrus has struggled to train pilots to be more aware of CAPS’ safety potential. While he doesn’t dismiss our findings, he said the small numbers may not necessarily be statistically significant. But he also concedes that with CAPS, Cirrus ought to have the potential to have a much better safety record than a similar equipped aircraft without it.
Cirrus has its work cut out for it to make that a reality, in our view. Everyone we talked to agrees that there’s more to the equation than just putting a red handle in the cockpit.


