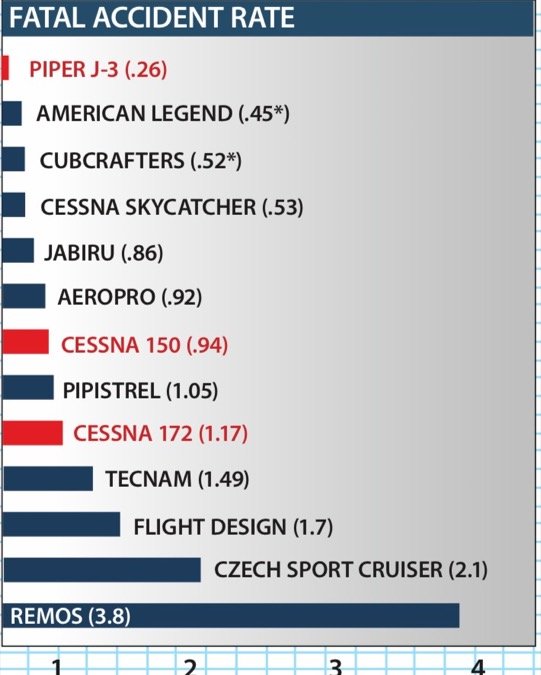
Two decades ago, when the light sport aircraft idea was being hatched, skeptics worried that lighter, cheaper airplanes flown by pilots without medical certs would lead to a spike in the accident rate. After all, without FAA oversight of design, manufacturing and pilot health, how could it not? The reality, while challenging to pin down, is mixed. According to our review, the light sport segment definitely has a higher overall accident rate than that of legacy certified aircraft. The fatal accident rate, by our calculation, is also higher at 1.6/100,000 hour compared to 0.93 for all of GA, but this varies by aircraft model and is a marginal difference because of such small numbers.
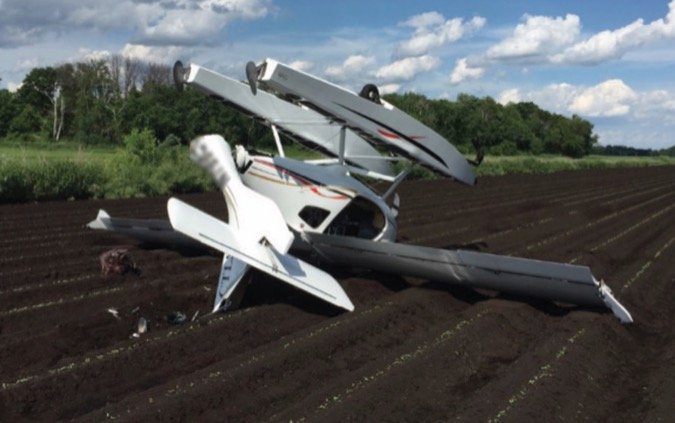
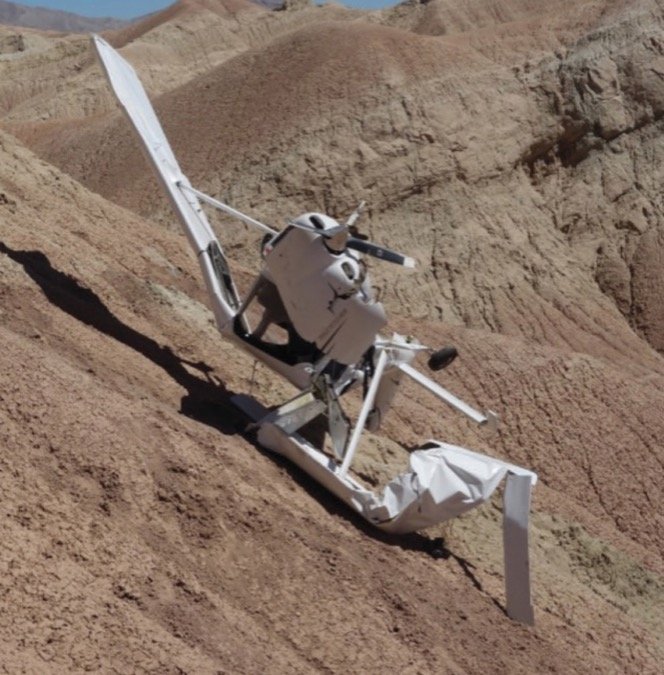
On the medical front, our review of more than 200 accidents revealed little evidence of medical incapacitation as an accident cause. In fact, light sport airplanes crash for the same reasons their heavier legacy brethren do: runway prangs, loss of control, stall/spins, fuel exhaustion and spatial disorientation, although the relative distribution of these causes is different for LSAs.
Judging the light sport segment is complicated by the low population of aircraft. Our study sample comprised only about 2000 S-LSA airplanes in the field since 2004, while legacy models date to the 1950s and total some 150,000 piston airplanes. This means that a handful of LSA accidents can bump the needle in an unfavorable direction. But in our view, that limitation is not reason enough to ignore the light sport safety record.
Details and Caveats
Calculating general aviation accident rates—especially by model or manufacturer—is fraught because although the accident data is available, the all-important accurate exposure data is not. Accident rates are traditionally calculated by dividing accident numbers by hours flown and are expressed in accidents per unit hours flown, typically 100,000 hours.
But we don’t have reliable hours data by aircraft model. Because of this limitation, we estimated flight hours by model/manufacturer using the General Aviation Manufacturers Association annual flight hours estimate of 91 hours per year for GA pistons and 81 hours for LSAs. Given the decline in flight activity, these may be optimistic but we believe they’re reasonable for comparison. We used NTSB accident and incident reports between 2014 and 2017 as the numerator.
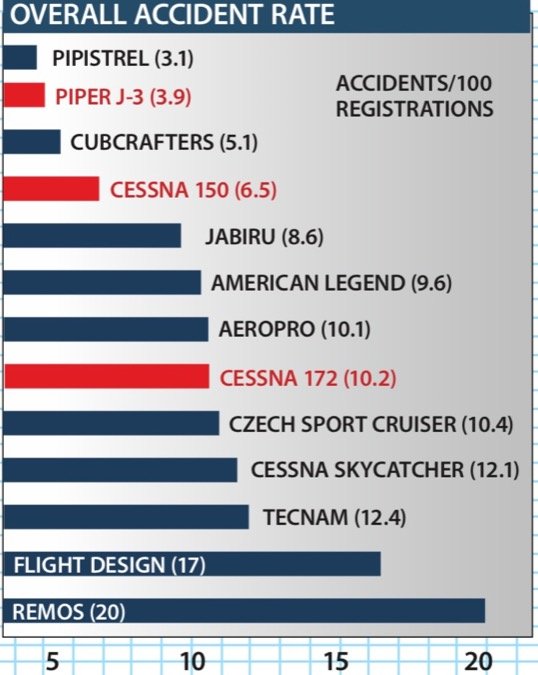
To broaden the analysis, we also examined accidents per 100 aircraft registered. While this does give a longer view, the static registration data is blind to the fact that some models and some specific airplanes fly more than others and thus have more exposure.
A second caveat—and this applies even if flight hours are known—is that not all accidents and incidents are reported in the NTSB database. Take the example of a light sport that runs off the runway, rips off a gear leg and is recovered and repaired with no report to anyone, perhaps even an insurer. We know this happens; we don’t know how often it happens.
Last, miscoding occurs in both the FAA registration data and especially NTSB data, which sometimes reports models with different nomenclature so finding them requires multiple search terms. J-3, for example, returns 16 records; J3 yields 146. Bottom line: The registration data doesn’t necessarily show all the aircraft in a discrete fleet and the NTSB data is not necessarily complete. Also, some manufacturers say that the FAA registry shows fewer airplanes than they claim to have sold, but we’re sticking with the available published data.
Small Numbers
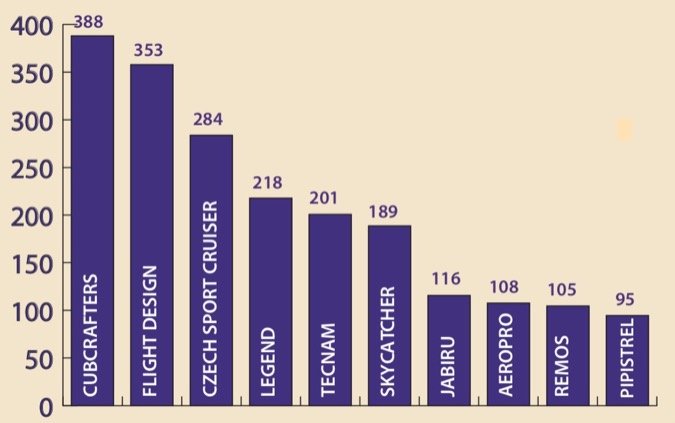
As shown by the market glimpse chart at right, in considering LSAs, we’re dealing with small numbers. The top 10 manufacturers have placed about 2057 airframes into the U.S. market and Dan Johnson, head of the Light Aircraft Manufacturers Association, estimates the entire fleet comprises about 3000 fixed-wing airplanes built as LSAs. An additional unknown number of legacy aircraft are flown under the sport pilot rule, but aren’t specifically LSAs. We didn’t consider them in this survey.
Overall, for this group of 2057 aircraft, we found a composite overall accident rate of 12.9/100,000 and a fatal rate of 1.6. For general aviation as a whole, the overall rate, according to NTSB data, is 5.78 and the fatal rate is the lowest in years, at 0.94. Our accident rate by registrations analysis shows similar trends even though the numbers don’t align precisely.
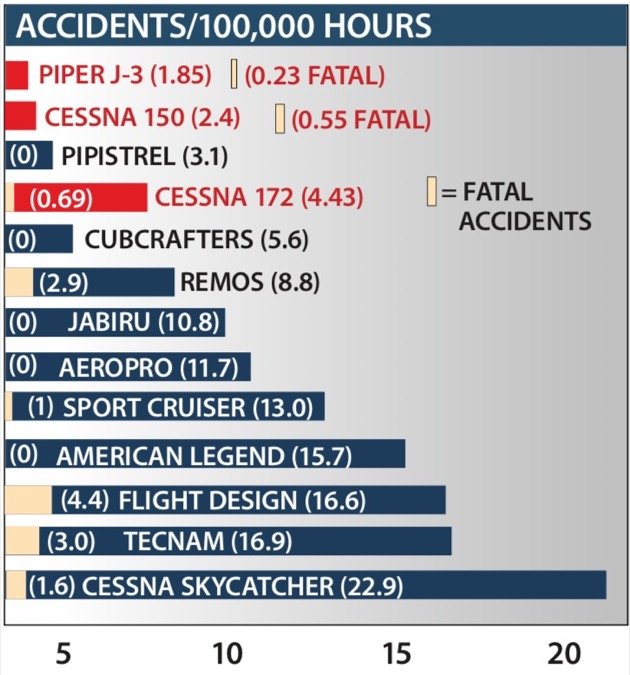
The charts—both hours and registrations—offer some perspective on LSAs compared to legacy stalwarts like the Cessna 150 and 172 and even the venerable Piper J-3. The 172, for instance, has an overall rate of 4.43/100,000 hours and only the Pipistrel fleet betters this, but on numbers too small to be credible. Of the top five light sports, CubCrafters has the lowest overall rate at 5.6, while the discontinued Cessna Skycatcher is highest at 22.9. (The registration analysis parallels this finding.)
Why the difference? Probably because the Skycatcher is used heavily in student training while the CubCrafters airplanes are not. This is also true of the Flight Design series, which has the second highest overall rate and the highest fatal accident rate. Many of these accidents are minor runway excursions and loss of control on landing or takeoff and, technically, aren’t required to be reported. They are, nonetheless, part of the pattern that comprises the airplanes’ operational history.
Diving into the details, the CubCrafter accidents are more widely varied and don’t involve quite as many students. Since the Sport Cub and Carbon Cub are taildraggers, you’d expect to see groundloops and, sure enough, that’s the case.
But the Remos airplanes have the same number of accidents as CubCrafters on less than a third of the aircraft population. The clearly discernible pattern is pilots botching the flare—usually too high—bouncing and departing the runway. Some of these are violent enough to cause injuries and many damage the airplane, an all-too-common complaint about LSAs.
The same pattern applies to the Cessna Skycatcher and the Flight Design aircraft. Both of these aircraft are used heavily in training and both suffer an unending bashing from stalls above the runway, low flares, crosswind careening, catching wings and just running into stuff. Judging by the number of landing gear parts sheared off, it’s hard to imagine that these airplanes will survive years of training in the way that the 150 and 172 have. (Some 8600 150s have survived decades of everything students could throw at them.)
One of the puzzling findings of our research is how the Flight Design aircraft fared. As a fleet, whether judged by hours or accidents per registration, they appear to have high accident rates and have the dubious distinction of having the largest number of listed NTSB occurrences—three times that of CubCrafters on slightly fewer airplanes.
What’s going on here? Again, mostly hard landings, botched flares and runway excursions. A lot of runway excursions, followed by noseovers, which are somewhat unusual for tricycle gear aircraft in general. These findings are surprising given that it’s both one of the most comfortable and best handling LSAs we’ve flown. LAMA’s Dan Johnson, who owned a CTLS, says speed control is likely the issue. “It lands fine at 55, but at 60, it’s going to float. If the airplane has a flaw, that’s it,” he says.
Flight Design’s Tom Peghiny challenged our findings, arguing that the company uses Aviation Safety Foundation data that shows 33 accident occurrences rather than the 61 we found in the NTSB records. “We also question that the raw data gives a fair analysis. Flight Design has had a larger fleet in operation than Cessna Skycatcher, Tecnam, CubCrafters (SLSA model) and Pipistrel for a decade. We had 288 planes flying in the USA as of 2008 and it wasn’t until 2013 that we had our first fatal accident. The statistically fair way to estimate is accidents and incidents per fleet hours,” he argues.
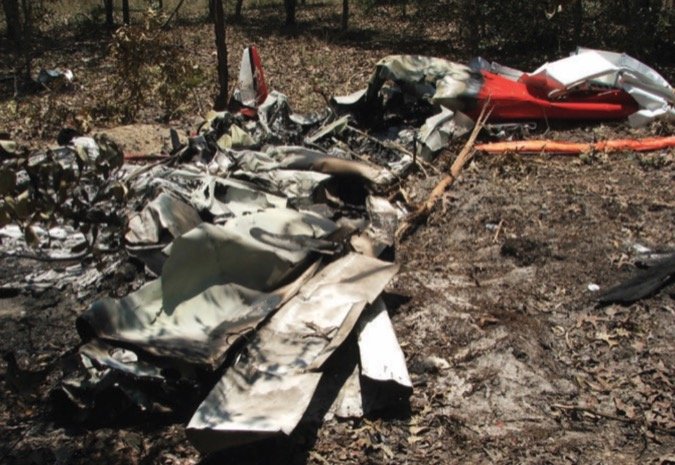
Flight Design’s fatal accidents—six total—show no apparent pattern. There were a couple of stalls, an engine failure and loss of control in a dust devil while landing.
We did see patterns in two other models, the American Legend and Czech Sport Cruiser. Half of the Legend’s 21 accidents were caused by noseovers. CubCrafters also had such accidents, but not as many. We attribute the difference to heel brakes being standard in the Legend rather than toe brakes in the CubCrafters airplanes. The problem with heel brakes is that in a panic situation, say to arrest a groundloop, getting the feet positioned is difficult and can lead to locked wheels.
Legend’s Mike Taylor told us the airplane’s brakes aren’t like the old wheezers in J-3s, but are powerful and require care. He says the airplanes are still highly rated by insurers.
The Czech Sport Cruiser’s slick good looks come in part from its bubble canopy, which is hinged at the front. We noted a pattern of the canopy opening in flight, possibly because the pilot didn’t latch it correctly. Although the POH says the canopy will lift a couple of inches and airplane’s aerodynamics remain unaffected, this has proven distracting enough to be a factor in nine of the Sport Cruiser’s 32 known accidents. One of these was fatal and all involved aircraft damage.
Age, Experience
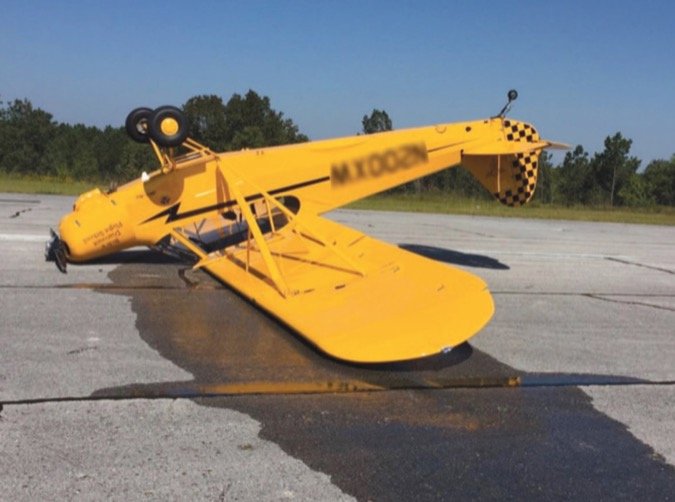
If the FAA and industry stalwarts thought inexperienced and modestly trained pilots would have higher accident rates, the data is murky on this. In fact, the accident record reveals that LSA accidents involve pilots who are both older and more experienced; sometimes vastly experienced.
Our review found that the average age of accident pilots was 60 and the average total flight time was 2458 hours. Many pilots in the accident pool were in their 70s and 80s; a few were nonagenarians. Some appeared to be low-time private pilots or perhaps sport pilots getting back into flying after participating earlier in life. There is no apparent pattern that age-related pilot incapacitation was causal in the accidents we reviewed.
The data is fuzzy on how many of the accident pilots are actually sport pilots and not private or even ATPs exercising sport pilot privileges because they don’t have a medical.
We counted 19 sport pilots in the group of 212 accidents or 8 percent. That’s a definite overrepresentation since according to the FAA, as of 2017, there were 6097 sport pilots or a paltry 1 percent of the 609,306 total pilots in the U.S.
We counted nearly as many ATPs—14—and a bunch of private and commercial pilots, confirming what LSA manufacturers have been telling us: The market is driven by so-called step-down pilots who are selling their Bonanzas and Mooneys to get into something cheaper and by retreads coming back now that they’re nearing retirement and can afford it.
For certain models, the discontinued Skycatcher, for instance, and the Flight Design series, student presence in the accident record is higher, but for others, like the CubCrafters Carbon Cub, it’s lower if not non-existent. The Remos suffers a high accident rate, apparently for the high number of runway loss-of-control events. Two of the Remos fatals were due to pilots failing to correct the airplane’s quick-disconnect control circuitry correctly.
Light Stick Forces: The Downside
On May 6, 2011, NTSB investigator Paul Cox had an apparent mystery on his hands. The burned wreckage of a Piper Sport was found near Spring Hill, Florida, north of Tampa. Inexplicably, the pilot’s body was found a third of a mile away. There was no evidence of inflight fire or structural breakup. The pilot’s personal items were scattered along the radar path leading to the wreckage.
Cox’s investigation revealed that the seat harnesses were burned but a belt adjustor was distorted in such a way to suggest rapid onset negative-g loading. An autopsy revealed the pilot’s shoulders were bruised where the belts would have been.
The investigation concluded that the pilot was reaching for something in the baggage compartment and because of the Sport’s exceptionally light pitch forces, he inadvertently applied enough rapid roll/pitch input to overload and break the belts and eject himself from the cockpit. Complicating the scenario was that the pilot was flying at night in an airplane not approved for night flight.
This accident is an extreme example of the danger of light stick forces, and the Sport Cruiser/Piper Sport are among the lightest we’ve flown. A few years ago, an instructor from Massachusetts sent us a picture of a light sport with a jagged hole in the top of the canopy. A student had overpitched with sufficient vigor to dislodge a fire extinguisher and drive it through the canopy.
In more benign circumstances, light pitch forces encourage the kind of ballooning flare that, if not immediately corrected, commonly leads to stalls, hard landings, excursions and not infrequent noseovers.
Excessively light pitch and roll forces complicate landings in gusty crosswinds because rapid corrections are needed and light stick forces encourage over-controlling.
Conclusion
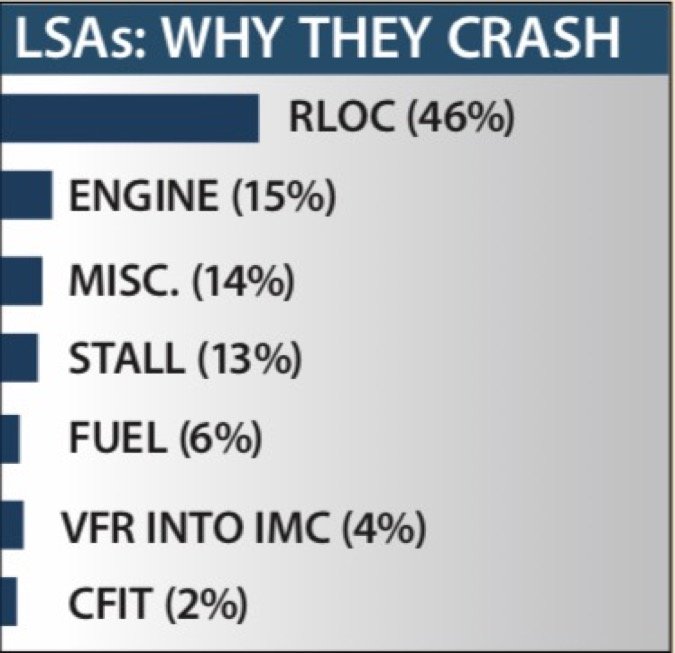
Some broad conclusions: Pilots crash airplanes for basically the same reasons they always have and light sport hasn’t changed that. Runway loss of control remains the leading cause of non-fatal accidents. Stall/spin tops the list of fatal crashes, with engine failures a close second. Pilots still occasionally try to run engines on air and it still doesn’t work.
It’s not clear if, by dint of less structure, LSAs in general are less crashworthy. The crash numbers are too small and the data just doesn’t inform this judgment. But it is clear that in some accidents, failed landing gear caused an accident that might not have otherwise happened because the gear just didn’t stand up as we’ll as it would have in a Cessna 150 or 172. Not for nothing are those 40-year-old airplanes still in daily service.
Based on our analysis, the light sport accident record in general is nothing to celebrate. In our opinion, it suffers from small numbers syndrome, but even if the fleet numbers and hours are notionally doubled, the accident rates are still higher. A 2016 study by the FAA’s Civil Aerospace Medical Institute found a light sport accident rate of an alarming 29.8/100,000 and a fatal rate of 5.2. These are much higher than our findings, possibly because they include E-LSAs and used personal flying hours rather than total hours. If the CAMI study overstates the case, the directionality confirms our research.
Tecnam’s Shannon Yeager observes that one reason for the higher accident rates is that all LSAs have low wing loading and pilots stepping down from heavier legacy airplanes can be slow to adapt. Even with the higher rates, Yeager believes the ASTM consensus idea isn’t diminished.
While we agree with that view, we think light sport manufacturers can and should address aircraft and training shortcomings. For example, it’s reasonable to suggest that if American Legend offered only toe brakes, not heel brakes, it would have the same noseover rate as its competitor, CubCrafters.
Flight Design offers customers a five-hour training program, but it might follow the Cirrus example and embark upon a dedicated training program to address landing techniques in that aircraft, perhaps on a recurrent basis. The manufacturer with one of the lowest accident rates, CubCrafters, offers a tiered training program that can take up five days and 30 hours. The numbers seem to suggest that approach is working.

