Insight Engine Monitors: Useful Diagnostics

The G-series analyzers are intuitive, value-priced and offer decent troubleshooting utility, but they cant be installed for primary gauge replacement.

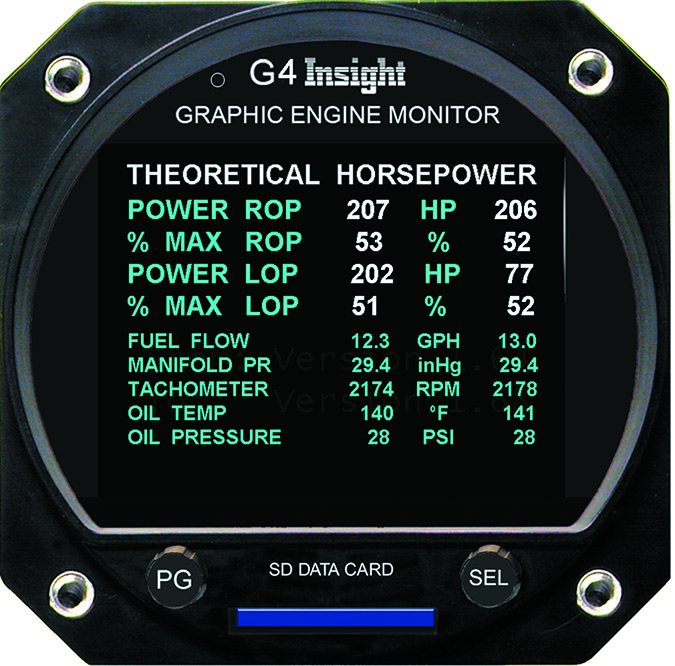
For a few years now, Insight Avionics has been selling its G-series line of color engine analyzers. The company is hardly a stranger to the engine display market. Its first-generation GEM series (graphic engine monitor) sold well and delivered on quality, but these instruments fell short on advanced diagnostic utility for lack of modern software.

The new G1 through G4 series color analyzers change all that for the better. Insight’s latest version of operating software enables generous amounts of built-in engine and airframe diagnostics that could save troubleshooting time when the aircraft hits the shop floor, while providing advanced warning of component failures. The new feature set also dumbs down the engine leaning technique to a near-foolproof level, which could keep the engine out of the shop in the first place.

In this article we’ll look at the entire Insight analyzer line, from entry-level to flagship systems.

GEM Plug-and-Play

Off the bat, Insight did the sensible thing and engineered the entire G series to work in an existing Insight GEM installation, although it could require some basic wiring changes. In many cases, the new G-series control head (roughly $1000) can connect with the existing harness and engine probes, eliminating a total rewire. But before you begin any engine monitor retrofit, pick the right shop for the installation. The worst hands in the installation can make the best engine monitor useless.

Insight’s current entry-level monitor is the 2.25-inch G1, which doesn’t have a fuel flow computer. This means you won’t have the advanced leaning functions that are standard with other models. The G1 doesn’t come with RPM, OAT, manifold pressure, RPM or oil temperature functions. It does have EGT, CHT, TIT and carb temperature capability, plus it’s approved for use as a primary EGT/CHT/TIT instrument.

As with all of the G-series monitors, the instrument has a high-resolution color LCD display, while the user controls are limited to two rotary knobs/buttons at the top and bottom of the instrument’s bezel. The top knob controls screen selection, while the bottom knob controls items within the given screen. Each screen assigns its own functional needs to the controls that may change, depending on context.

Some screens have intuitive prompts, including “push to exit,” should you get lost in a menu. The basic G1 has three primary screens. This includes the EGT/CHT bar graphs (each cylinder has its own display column displaying both CHT and EGT simultaneously), a basic engine leaning screen and an EGT/CHT sensor probe diagnostic screen. With probe diagnostics, there’s no more guessing if an unusual parameter is related to a faulty sensor or a real problem, since this diagnostic screen displays the measured health of each temperature probe.

On the main page, all monitored temperatures are continuously displayed in both a color-coded bar graph and in numeric form at the bottom of each bar. A CHT redline appears on each bar, while the CHT graphic bar turns yellow at 410 degrees and red at 460 degrees. For turbocharged applications, the green TIT bar turns yellow at 1600 and red at 1650 degrees and, while a TIT redline is displayed above the TIT bar. In carbureted applications, the carb temperature function (it’s an option on the G1 and standard on the rest) is displayed in the center of the display.

The G1 for four-cylinder applications starts at $1235 and $1365 for six-cylinder engines. The carb temperature probe is $176 and the TIT function for turbocharged engines is an extra $200. Insight told us a basic installation on a four-cylinder engine might be accomplished in an afternoon, but we think that’s optimistic. Installing the control head, removing and reinstalling the cowling, installing the probes, final testing and paperwork could turn into a multi-day project, based on our experience.

Leaning Assistance

The G2 (which fits a 2.25-inch instrument cutout) has all of the G1 functionality, plus an integrated fuel totalizer. If you have an existing Shadin or JP Instruments fuel computer, Insight offers a fuel flow signal adapter so you can use the existing fuel flow transducer. That could yield a sizable savings on the installation.

The G2 shows the current fuel flow, plus it has a generous fuel computation page. It’s also compatible with a variety of GPS navigators for endurance calculations. It’s worth noting that none of the G-series monitors have fuel quantity sensing.

The fuel stability feature, which measures and displays fluctuations in the metered fuel flow, can be useful for spotting clogged fuel injectors and carburetor bowl problems.

The G2 has a starting price of $2093 for four-cylinder engines and $2275 for six-cylinder engines. A kit for a six-cylinder turbocharged engine is $2495.

Intended for fuel injected engines and LOP (lean of peak) operation, Insight’s flagship G3 and larger (3.125-inch round) G4 take the integrated fuel computer to a higher level with Insight’s patented lean assist feature.

In leaning mode, the instrument intuitively tells you exactly how far the EGTs have dropped since they peaked, whether you are on the rich or lean side of peak and what the fuel flow was during the peak. Rich and lean of peak conditions are displayed on the screen inside number blocks, which are positioned above each cylinder bar and are shaded in either cyan or white for easy recognition.

Entering (and using) the leaning mode should be simple, and on the G3/4, we think it is. The lean function is manually accessed by holding the SEL button, or by leaning the mixture. Begin well rich of peak EGT and the white columns for each cylinder rise until achieving peak EGT. At that point, a lean box appears above the EGT column and the fuel flow on the corresponding EGT column will freeze. This is what the fuel flow was when that cylinder hit peak EGT. Continue leaning the mixture and white boxes appear above each column as the other cylinders hit peak EGT, showing “L” and the degree value. For rich of peak, stop leaning when the first cylinder peaks and gradually enrichen the mixture until the boxes turn cyan, while showing an “R,” plus the temperature value.

It’s easy to decipher uneven mixture distribution, or GAMI spread. As each cylinder hits peak, the fuel flow freezes on the corresponding EGT column. The difference between the fuel flow of the first and last cylinder to peak is the GAMI spread.

Insight said they designed the G-series instruments for minimum heads-down time. One example is threshold leaning. Pressing the SEL button opens a menu for setting peak leaning threshold, which is already preset at the factory for 50 degrees lean and 50 degrees rich of peak, but you can change them by turning the SEL knob. When each cylinder hits the lean threshold, the data box turns solid (white-filled) for at-a-glance leaning. This helps aging eyes that might struggle to read the numbers in the box on the 2.25-inch instrument. Simply lean until you see the boxes turn white.

Electrical bus voltage and OAT is standard on the G2 and above, as is datalogging, which automatically stores data to a supplied SD card for Mac and Windows-based computer analysis. The data can also be accessed in flight. The G1 doesn’t have a datalogging feature—the SD card slot on the front of the bezel is used for updating the operating software.

The G3 and G4 come standard with oil temperature and oil pressure sensing and display, plus manifold pressure and RPM display. This data is shown at the top of the display for supplemental reference only.The system also accepts an air data computer input for enhanced fuel computations.

EI CGR-30C Cluster Gauge as Companion

The buzzkill of the otherwise strong Insight engine monitor product line is the lack of a primary replacement model. Insight says it’s working on one, but we think some buyers pass on a high-end G-series monitor in favor of an all-in-one replacement from the competition, including JPI and Electronics International.

Still, for Insight customers sold on a G-series monitor, but who are looking to ditch OEM mechanical engine gauges in favor of self-contained electronic ones, Insight’s marketing director Brian Wrightman sends them to competitor Electronics International for the CGR-30C electronic engine cluster gauge. We think that’s a good option and a worthy companion to an Insight analyzer.

The $2952 CGR-30C is the same form factor as the company’s CGR-30P analyzer, which can legally replace the tachometer and manifold pressure gauge, plus has basic engine monitoring functions. It doesn’t have the advanced leaning and diagnostics utility of the Insight G series.

The TSO’d CGR-30C has broad AML-STC approval to replace all existing engine instruments, including fuel quantity gauges. The installation is as streamlined as it can be, thanks to an engine data converter hub.

The CGR-30C uses the EDC-33P (engine data converter) for combining all of the aircraft’s engine gauge signals into one serial databus, which reduces the wiring bundle from engine and airframe to the instrument panel by over 100 wires. Better yet, a single EDC can drive multiple CGR display units.

What we like about the CGR-30C cluster instrument is it fits flush in a 3.125-inch instrument hole. Unlike other all-in-one replacement displays that require major instrument panel modification, the CGR is a bolt-in. It has a 144-color active matrix display, which is sunlight readable and has a wide viewing angle. That’s a good thing, since many existing mechanical engine cluster gauges are located on the copilot panel. Contact EI Electronics.

Specialized Analysis

Insight was the first to incorporate vibration analysis in its monitors, believing that the function is the key to early detection of mechanical failures. Insight says the vibration functions should simply be used as a condition monitoring tool because obviously not every engine will map the same vibration signatures.

The sensing is done with a three-axis accelerometer installed on the engine case bolt, in close proximity to the propeller. Once the sensor is connected (it can be added to any G3 and G4), the instrument displays a dedicated vibration spectrum page with a waveform display. After using the utility for a while, Insight said users will recognize what is normal vibration and what isn’t. The trick is spotting new spikes, or recognizing that an existing vibration signature is worsening, evident by its growing in magnitude/wavelength.

Several users—including one who was trying to source the cause of vibration in his Cherokee Six—told us there is a learning curve, which requires operating the engine at different power settings and flight conditions. One user was able to track down airframe vibration originating from a buffeting landing gear door.

Moreover, the utility has various sub-screens (six total) for each of the remote accelerometer’s axis measurements. You can zoom in on the displayed waveform to make it easier to examine, while a cursor snaps to nearby vibration spikes in case you miss them. Since the data is saved to the instrument’s SD data card (in hexadecimal bytes in the log file) by pressing and holding the top bezel button, you can load the data to a computer where it opens in Microsoft Excel.

The exhaust valve analysis/periodic temperature variation screen is a tool for spotting slow variations in EGT, which can lead to exhaust valve failure. While the oscillation rate is too slow to be identified by temperature alone, a slow-sampled spectrum analysis can be performed in cruise flight at a constant power setting and altitude. The onscreen vertical graph shows a variation in temperature, while the horizontal line represents minutes of time. Normal indications will be a flat line with at least some graphed noise, but a valve problem could generate a spectral peak. The bottom button allows you to toggle between all cylinders.

There is also a three-axis accelerometer installed in the instrument’s chassis. It samples turbulence and landing shock. Insight says the feature is a training aid for flight schools, while also a predictor of structural damage. Since the data is logged to the SD card, operators can keep tabs on unauthorized aerobatic activity or abuse of rental aircraft. There is a two-axis G-load turbulence display of the vertical and yaw axis, plus time and acceleration values. The utility could be useful for knowing when to slow the airplane to maneuvering speed in turbulence.

Twins and Radials, Too

Insight offers a version of the G4 for twin-engine applications, plus several versions for radial engines. On the twin-engine model, you can monitor both engines simultaneously.

For tandem cockpits, Insight developed the G9 front and rear cockpit display combination. These instruments connect together through an RS-232 serial databus and should be available later this year.

As much as we like the G-series line of monitors, we think they’re overshadowed in a crowded market. For entry-level monitors on par with the Insight G1, there is the JP Instruments EDM700. It starts at $1645 for four-cylinder engines and $2000 for six-cylinder engines, but we think it’s showing its age (it doesn’t have a color display). The $2435 EDM730 does sport a TFT color screen, but its rectangular footprint overhangs the instrument panel, despite a chassis that slides into a 3.125-inch instrument cutout. For ease of mounting and advanced features, we give the Insight G-series the advantage.

As for choosing the right Insight model, we think the G1 is right for basic aircraft if you can live without a fuel totalizer. It still has basic leaning functions and as we reported in the June issue of Aviation Consumer, there are plenty of options for standalone and affordable fuel totalizers.

For fuel injected engines and for running lean of peak, we think the G2 is the hands down better choice. We like its stone simple at-a-glance lean assist feature, its SD-based datalogging capability and the bang-for-the-buck starting price. For finicky engines, the vibration analysis feature in the G3/G4 has some appeal, but at a sizable cost delta.

Editor in Chief Larry Anglisano has been a staple at Aviation Consumer since 1995. An active land, sea and glider pilot, Larry has over 30 years’ experience as an avionics repairman and flight test pilot. He’s the editorial director overseeing sister publications Aviation Safety magazine, IFR magazine and is a regular contributor to KITPLANES magazine with his Avionics Bootcamp column.